
Theo Günther · 28 September 2026
Emission Tracking Data Sparks Fresh Approaches to Regional Safety Protocols
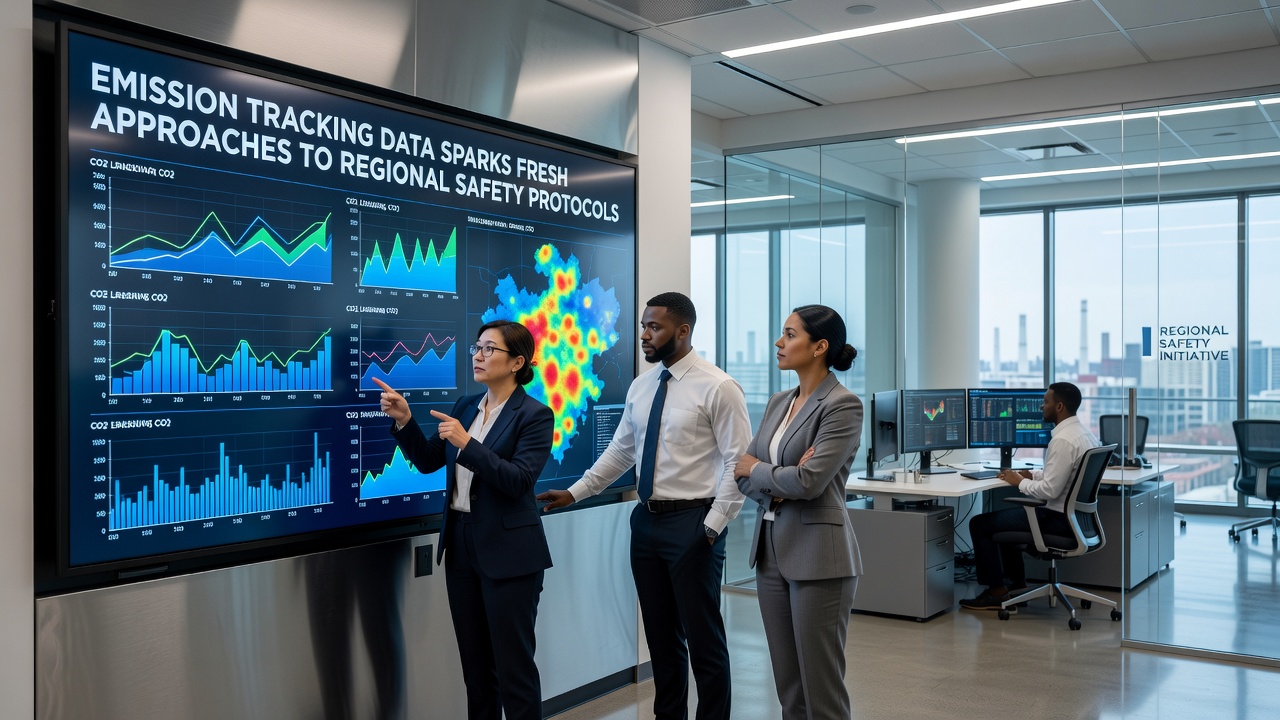
Recent releases of emission tracking data have prompted several regions to revise their safety protocols around industrial sites and transportation hubs, with new measures rolling out through late 2026. Data collected from continuous monitoring networks shows patterns in particulate matter and volatile organic compound releases that correlate with localized health incidents, leading agencies to adjust emergency response thresholds and public notification systems.
Officials in multiple jurisdictions began integrating these datasets into existing frameworks after September 2026 updates from national environmental databases highlighted exceedances in previously monitored zones. The information revealed that certain emission spikes occurred during routine maintenance shutdowns rather than peak production periods, which shifted focus toward predictive scheduling and buffer zone expansions.
Tracking Systems Behind the Data
Modern emission tracking relies on networks of ground-based sensors combined with satellite observations that feed into centralized reporting platforms. These systems record hourly readings for nitrogen oxides, sulfur dioxide, and fine particulate levels across urban and rural boundaries. Researchers at institutions such as the Environmental Protection Agency have documented how real-time feeds allow quicker identification of sources compared with traditional annual inventories.
One study from a Canadian federal program linked specific plume trajectories to increased respiratory complaints in downwind communities, prompting adjustments in alert timing. Similar patterns appear in reports from the European Environment Agency, where cross-border data sharing has clarified how industrial clusters influence air quality in adjacent areas.
Adjustments to Safety Protocols
Regions responding to the data have introduced layered response tiers that trigger at lower concentration thresholds than before. These include automated school closures when certain pollutants reach defined levels, expanded evacuation radii around facilities handling hazardous materials, and mandatory ventilation system upgrades in public buildings near high-emission corridors.
Transportation departments have altered routing for heavy vehicles during forecasted inversion events, while industrial operators received requirements for temporary production halts tied to sensor readings. The changes build on existing hazard mitigation plans but incorporate emission forecasts generated from machine learning models trained on multi-year datasets.
Geographic Examples of Implementation
In the American Midwest, county governments updated emergency operations centers to receive direct feeds from nearby refineries, allowing dispatch teams to stage resources ahead of predicted releases. Australian state agencies adopted comparable systems after reviewing emission records from port facilities, resulting in revised marine traffic guidelines during adverse wind conditions.
European municipalities have tested community alert apps that push notifications based on the same datasets, with adoption rates tracked through public health departments. Observers note that coordination between local fire departments and environmental monitors has increased joint training exercises focused on emission-related incidents rather than traditional chemical spills alone.
Supporting Research and Data Sources
Academic groups have contributed analyses showing correlations between tracked emissions and hospital admission rates in defined geographic clusters. EPA air research summaries provide baseline comparisons that regional planners reference when calibrating new protocol triggers. Additional findings from Australian government environmental reports detail similar linkages in coastal industrial zones.
These sources emphasize the value of granular temporal data over aggregated yearly totals, which enables protocols to address short-duration events that previously fell below regulatory attention. Agencies continue to refine sensor placement and data validation methods to reduce false positives in automated alerts.
Technological Integration
Many updated protocols now embed emission data streams into broader geographic information systems used by first responders. This allows mapping of potential exposure zones in real time during incidents, supporting decisions on shelter-in-place orders or traffic diversions. Software platforms aggregate inputs from fixed monitors, mobile units, and meteorological stations to generate scenario projections that guide resource allocation.
Industry participants have begun voluntary data contributions to these platforms in exchange for streamlined permitting processes, creating more comprehensive coverage across previously under-monitored sectors. The approach reduces reliance on periodic inspections alone and emphasizes continuous verification through shared networks.
Conclusion
Emission tracking continues to supply the factual foundation for evolving safety measures as regions incorporate September 2026 findings into operational guidelines. Continued expansion of monitoring infrastructure and cross-agency data exchange supports further refinements in response procedures without requiring entirely new regulatory structures. The integration of these datasets into daily decision-making reflects ongoing adaptation to observed emission patterns across varied geographic and industrial contexts.